
I have repeatedly written that when we are analyzing weather forecasts (GRIB-based included) and making decisions based on them, we must always remember that:
A weather forecast is only the most likely of several possible outcomes.
Me
For example, in this chapter in our Online Book on weather, I relate the story of how post-Hurricane Maria produced far more violent conditions than those being forecast just a day before and, worse still, from the opposite direction than predicted.
At the time, three yachts, including us on Morgan’s Cloud, were transiting southern Labrador and the Straits of Belle Isle in September, no place to get caught out in unexpected storm force conditions, let alone from a different direction than forecast. Luckily, I had recognized this possibility a full five days before it happened, giving all three boats plenty of time to find shelter from the actual wind direction.
I was warned of the potential danger because I was getting and analyzing 500 mb charts. But the problem is that it takes a lot of study and practice to learn this skill and many cruisers won’t have the time or inclination. (For those of you who are interested, we have a study guide.)
It’s important to understand that I was not any smarter than the professional forecasters. Rather, all I did was recognize that a deep trough at the upper level had the potential to combine with Maria as she went extra tropical and produce those unforecast conditions.
The point being that I’m sure the professionals knew that this potential existed too, but they had no way to warn anyone since they were constrained to one forecast.
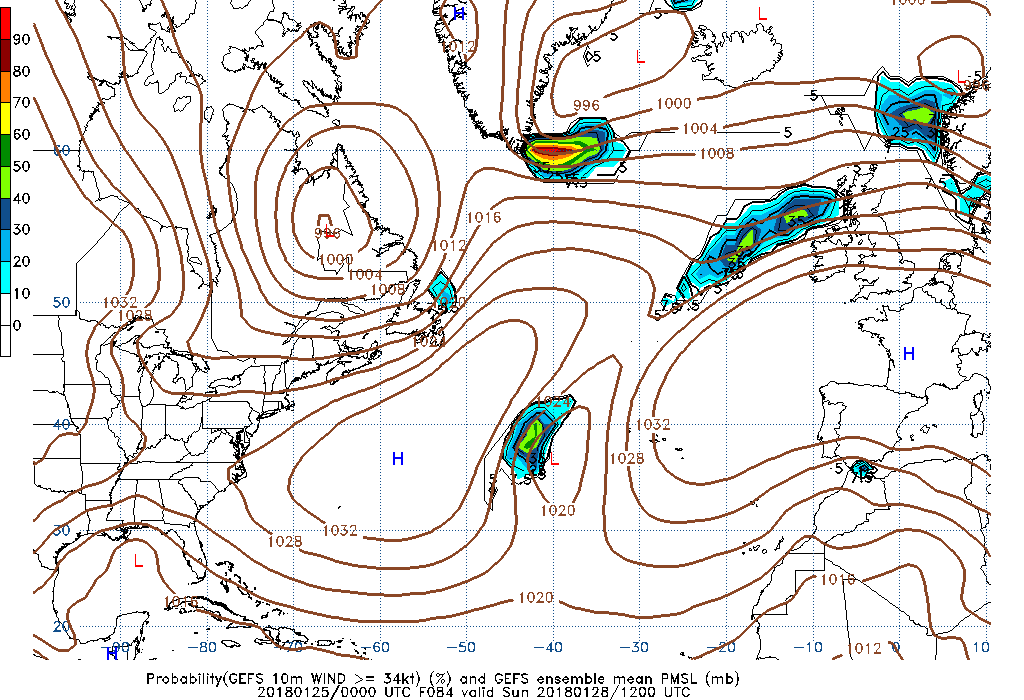
But now the folks at the US Ocean Prediction Centre have come up with an excellent graphic way to forecast multiple wind speed probabilities, instead of just one.
This is a huge breakthrough. To see why, have a look at the chart at the top of the post that shows the probability of sustained winds equal to or greater than 34 knots (gale force).
Wow, that could be a game changer. Grib meet pilot chart, pilot chart meet grib. Thanks as always John for keeping us up to date with what’s new in weather forecasting for offshore sailors!
Hi Todd,
That’s a great way to look at it, which I had not thought of.
Interesting and timely. One of Andy Schell’s seminars I attended last week here in Toronto dealt with this, as I asked if, in light of increasingly unseasonable weather, pilot charts/Admiralty Ocean Passages for the World were still of value in passage planning versus “playing it as it lays” with forecasting and routing products. This does indeed look like a “why not both?” solution that makes the squash zones stand out more clearly than just tight isobars. Conversely, if you can work out where the edges of the decent wind are, that is also great information. Wind makes the boat go!
Bring it on for the southern hemisphere. Australian Bureau of Meteorology uses a similar matrix for rainfall forecasts, both for short and longer terms, so I am quite used to the probability factors.
Hi Peter,
Yes, it’s a pity that they are not doing the probability forecasts for the south. It really does seem that you lot on the bottom of the planet are not as fortunate in forecast options as us in the north.
I just love that revolver analogy.
How long have you been working on that one? I’m still struggling with the interpretation of the 500mb charts so this may be of benefit to me. I’ve just recently landed up in the Canary islands and find the forecasting very hit n miss. What looks like a benign high pressure grib chart ends up blowing 30-35kts and I’ve no idea why. Perhaps if I store a few weeks worth of these charts I might learn something. Thanks for the heads up.
Garry
Hi Garry,
Glad you liked the analogy, actually it just came to me in a flash…scary I know.
As to the Canary Islands. I have not been there for 20 years, but I seem to remember that a lot of the wind is local influenced because of the high islands. If that’s right, then most GRIBs are going to struggle because they don’t take into local topography. You might want to try PredictWind since they model topography, at least for some parts of the world. We had another member that said PW worked well for him in the Med.
These are great but not sure they are what the chapter proports them to be. They are one dimensional in that they show probability of wind strength, not probability of a different outcome such as change in direction with some limited probability of upper level interaction. And pilot charts show likelihood of direction and strength – two dimensions. Or am I missing something?
Completely agree a great step forward.
Hi Michael,
Sure, you are right, they don’t deal with directional probability. Maybe that will come later, although I’m not sure how those two variables could be displayed without making things super complicated. Maybe using the same methods as pilot charts, not sure.
Still, even if that never happens, I stand by my breakthrough call since they are the first product I have seen ever that clearly warns of the inherent inaccuracies of weather forecasts.
I’m a bit of noob. Is there a way to download the NAEFS Probabilistic files into a grib format? When you don’t have internet, just Iridium Go, it’s not really possible to get this info.
Hi Tim,
No, as far as I know there is no way to get them as a GRIB. And in fact I’m not sure that would even be possible, or perhaps even desirable. Rather I see these as something to look at just before leaving on passage to access the chances of much worse weather than the GRIBs are showing.
That said, as long as we copy the URL before we go, it should be possible to download single charts at sea using Iridium GO! and unlimited data. So in this way we could, on a longer passage, say every three days download the 72hr/34k and the 72hr/48kn to see if bad risks were coming to a place near us.
Hi John.
Very interesting. It’s new and they say experimental, which may indicate there is room for much improvement. Some way of indicating probability for wind directions would also be interesting, but I have noe idea how that combination could be done in an visually easy to grasp format.
I assume more shiny interface and ability to pick any area might come sometime in the future, if they see it useful to develop it. I also assume that they will be more motivated for developments if the present solution gets widespread attention and use. I guess this article already made a noticeable difference in their traffic.
Either way, I’m certainly gonna use it! Maybe there is a deeper understanding and more info if a proper analysis is done, like you do, but I’m nowhere near capable enough to do that well enough, yet. Here I find better awareness than I’d be able to produce on my own. Great! Thanks!
Hi Stein,
Yes, I agree, We need to support this if we want to see improvements.
Something’s broken…
I can’t open the URL you included for the link “these new products” at the end of the article.
I’m using a Mac with Safari.
Hi Dan.
It worked fine for me just before i posted my comment above here. I was then using Chrome on an iPad Pro 12,9 2017. I tried it again, both from the link in your comment and those in the article. Now it just said page cannot be found. Same results from Chrome on Windows PC. I guess the page crashed from a sudden boom in traffic caused by this article? If so, it’s a bit cool, too…
Hi Stein,
I just think someone in NOAA changed a URL mapping and committed a typo. The biggest problem is who to notify? I couldn’t find anywhere on the site to notify anyone of a problem.
The given link works for me – obviously they already found and corrected the problem.
Hi Dan,
I just checked both links, and they are now working. Perhaps they had a temporary glitch. If so, I like Stein’s theory for why!
and the plot thickens…
It still doesn’t work for me with Safari on Mac. Having said that, I fired up Chrome on Mac. It works just fine. Websites are setup to detect the browser and OS being used and can change behavior as necessary. It seems someone at NOAA broke the link mapping for Safari on MacOS, but probably not any other browsers on MacOS, e.g. Chrome.
Thanks for the help.
Hi Dan,
That’s strange. I use Safari on Mac and it works fine. You might try clearing your browser cache.
Hi go I’m using an iPad with safari,
Go to OPC site,
Go to model guidance,
Go to probalistic,
Go to wind guidance,
Go to naefs, or gefs then select Atlantic if that’s where you want. Hope it helps
John,
Great post. Working in aviation for many years, i worked on a number of projects where different met offices were trying to implement probabilistic forecasting. As you mention, the benefits to this are large. The biggest problems which were conveyed to me in these projects were getting people to understand what a probability even means.
The example you used with the loaded gun was great, but i fear some people would still not understand that 2 out of 6 is high. People just are not programmed (yet) to understand 10%, 20%, 40% etc. Which then comes down to understanding and managing your own risk. again, someone the average person may not be vers on.
None the less, great information… glad to see this type of weather product is coming to the sailing community.
Hi Ryan
I think this is a very interesting topic. Understanding risk is depending on understanding probability, of course. As the saying goes “Risk equals consequence multiplied by probability.” I think nobody here will have any problem with following that logic and fully understanding what probability means. I still agree with you that understanding is not the same as having it incorporated in the decision process. Especially not so when decisions are made more or less intuitively.
Some people will when driving a car think “I HAVE to get past that car NOW! I can’t see around the turn, but I’ll risk it.” That’s being extremely blinded by an emotional mind set, but far from unusual and milder versions of that mechanism are active in all our minds all the time. The “russian roulette” analogy John uses is spot on.
I have discussed this topic with sailing friends and then bring up the question: “Do you think a 1% probability of wrong outcome is low enough to take a risk?” Very many say yes, they’d take the risk, without thinking about what “wrong outcome” might mean. If I then say the risk they were taking on was to sail long distance with a 1% probability of a massive hurricane hitting them. 1% every day. The trip can easily last more than a hundred days. Meaning that the total risk of getting into a disaster hurricane during those 100 days would seem to approach 100%.
In statistics, and in real life, one can’t really add up percentages like that, and most days have 0% chance of hurricane, but when we see a 1% risk, we might want to imagine that we are counting down on a relatively few days of 1% risk exposure until the risk becomes overwhelming.
Bullets to the head or disaster hurricanes are extreme cases of unacceptable consequence, death. Most will put a limit much lower. Something we won’t like, but we can handle it without fear of grave danger. Obviously, the evaluation of what weather we consider as that limit will vary wildly with boat, crew, location, time, etc. But do we assess real limits for what we want and what we can’t risk every day? Should we maybe make some habits of updating that assessment just before we do the weather routing etc?
Hi Stein and Ryan,
Great assessment of the risk issues.
Sadly, I think Ryan may be right about the general inability out there among cruisers to understand weather risk. The very fact that people get really excited about automated weather routing packages and never mention the consequences when they are wrong, or the fact that said packages often are very wrong, kind of proves Ryan’s point.
I also really like Stein’s analysis and both the car and hurricane analogy. And I’m all over “Risk equals consequence multiplied by probability.” Sums it up on one great sentence.
Anyway, I hope these new forecasts will help get more understanding out there.
Thanks to you both.
For those studying (and struggling with) upper air charts (550 mb), buried in the Ocean Prediction Center site, under top menu item”INFORMATION” / About OPC / User Training, there is “Jet Stream — An Online School for Weather”. Topics include “The Upper Air” and “Upper Air Charts”, each of which I found helpful. After reading those, I think I can return to John’s upper air chapter and to the Chen and Chesneau text.
Hi Michael,
Thanks for that heads up. We all need all the help we can get in that area!
Thanks for this. I’d seen this Noaa page but didnt realize how important it can be in planning a trip. Double thamks.
Hi John,
Looking at the >48 Kts chart loop I also realized that if you scroll down and set the chart to 15 Kts it will give you a very good indication of where the areas of calm winds are in order to avoid them. I don’t remember you commenting on this. Can you please expand?
Thanks,
Giorgio
Hi Giorgio and Jan Aru,
Well, first off, I have not yet used these products on a real cruise, so I hesitate to be too certain of anything relating to them. That said, I don’t think they would be good products to use to avoid calms since, as I understand it, the whole purpose is to show the probability of harder winds than forecast.
Great article. I have been sniffing around the new Weather Prediction Center site, but had not found the probabilistic graphic displays.
Hi John,
Thanks, glad it was useful.
Really useful find, thanks! And don’t forget Opencpn has some excellent options for viewing gribs/synoptics/sat images etc with the grib plugin and weatherfax plugin. I just added a probabilities image by hand for a look – lots of info.
https://www.dropbox.com/s/34n90rf74pizcdp/ProbWind.png?dl=1
PS – can you post image in the comments?
[IMG]https://www.dropbox.com/s/34n90rf74pizcdp/ProbWind.png?dl=1[/IMG]
Maybe not, sorry – try this link so you don’t have to download –
https://www.dropbox.com/s/34n90rf74pizcdp/ProbWind.png?dl=0
Hi Paddy,
That’s interesting. I really must try and find the time to have a look at OpenCPN. Thanks
I’ve been using it (and will continue to do so for certain aspects of route planning) for several years now on an otherwise elderly netbook with a simple GPS puck. It really is impressive for the price and the very wide range of data and functionality that can be displayed. And as an open-source program, there’s a considerable community that’s developed very competently written apps for it. Yes, there’s a learning curve, but it’s not steep and you can use it in a basic form if you wish. Now that I regularly use a B&G plotter, it’s interesting to compare and contrast the two in action. Putting GRIBs and probablistic data into a plotting program is amazing to get a mental picture of one’s opportunities to either make use of or dodge wind fields on passage.
OpenCPN is a great program, and the weather plugins are really useful for easy downloading and viewing synoptics & grib. I’m fiddling at the moment on and off to try and auto save gribs & synoptics to google drive daily to try and see just how accurate they are over time. I’ll send a link if I manage to get anything useful set up.